La testina di incisione, come abbiamo visto in precedenza, trasforma la corrente che arriva alle sue bobine in vibrazioni dello stilo di incisione. Può essere considerata come un elettromagnete, simile a quelli che si trovano nei sistemi telefonici convenzionali, ma con una potenza maggiore in gioco.
Oggi, nelle testine stereo, le bobine sono posizionate ad angoli di ±45° rispetto al piano di modulazione, cioè alla superficie del disco master. Di conseguenza, sono distanziate di 90° l’una dall’altra. Questa configurazione fa sì che i solchi che vengono incisi contengano sempre informazioni sia verticali che laterali¹.
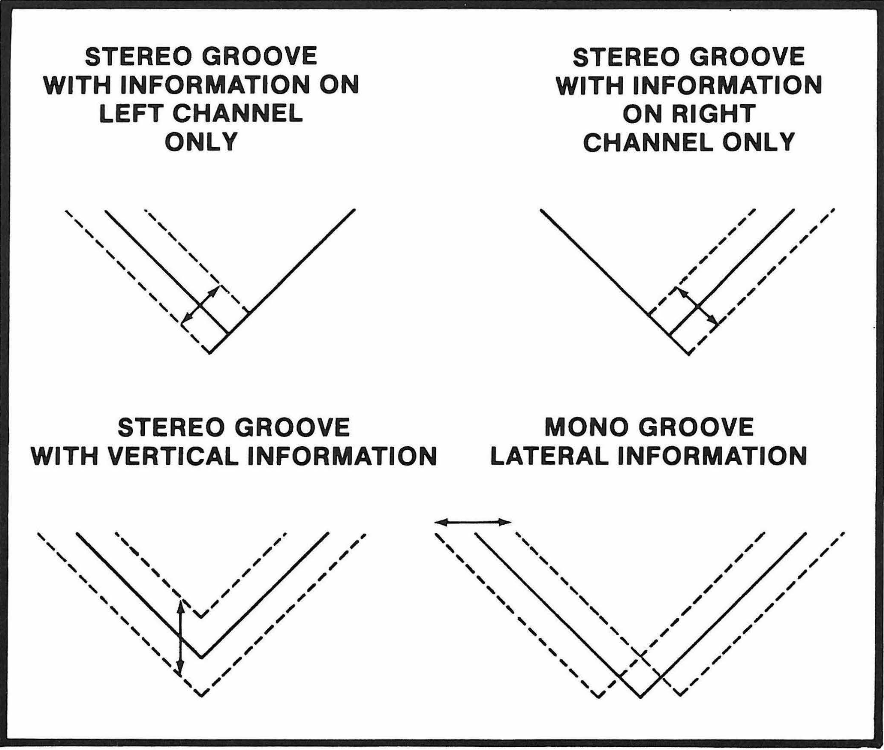
Questo sistema, introdotto per la prima volta dalla Westrex negli Stati Uniti oltre 50 anni fa, è diventato rapidamente lo standard del settore. All’epoca, i dischi mono erano ancora i più diffusi, e la rotazione di 45° dell’asse verticale ha consentito per la prima volta di incidere un segnale stereo nel quale i solchi che venivano incisi avevano una geometria abbastanza lineare e facilmente riproducibile. Cosa che non avverrebbe, ad esempio, se uno dei due canali facesse muovere lo stilo in verticale e l'altro in orizzontale.
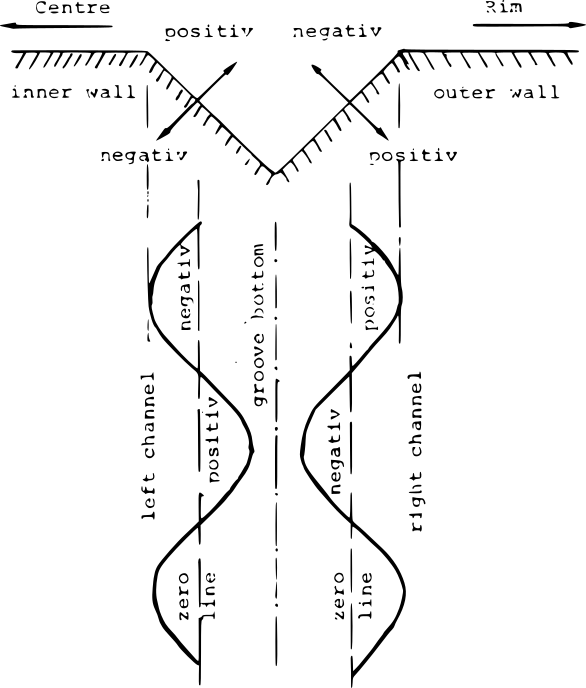
The previous figure² illustrates the logic of groove cutting, assuming the cutter head moves from right to left, toward the center of the disc.
First, it’s clear that the right channel is always cut on the groove side facing the outer edge of the disc. Also, the polarities of the two channels are opposite:
- sul canale destro, la polarità "+" fa scendere in profondità lo stilo, lungo l‘asse inclinato di 45°, e viceversa;
- sul canale sinistro, ciò accade con la polarità "-".
Quindi, se si incide un segnale stereo monofrequenza con la stessa ampiezza in entrambi canali, vi saranno solo escursioni laterali dello stilo, che seguono la forma d'onda.
Se invece il segnale ha ampiezza diversa sui due canali, oltre all‘escursione laterale ci sarà anche un'escursione verticale più o meno contenuta, che produrrà una variazione della profondità del solco.
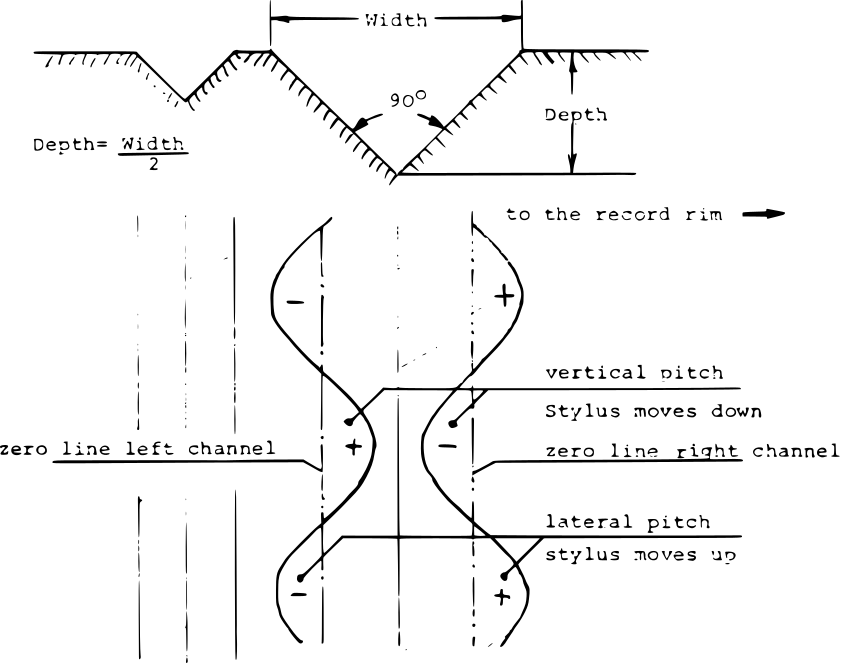
As seen in the previous figure³, let VL and VR be the modulated voltages of the two channels, keeping in mind they have opposite polarities. Then:
- quando (±VL) + (±VR) diminuisce, lo stilo di incisione incide con una profondità maggiore;
- quando (±VL) + (±VR) aumenta, lo stilo incide con una profondità minore.
Tutto questo è facile da osservare quando viene inciso un segnale in cui è presente una sola frequenza. Quando il segnale è composito, le varie frequenze si accavallano l'una sull'altra. L'effetto più visibile, a livello di solco, sarà dato dalla frequenza prevalente, ma anche altri aspetti del segnale saranno visibili: al microscopio, ma talvolta anche ad occhio nudo.
Ad esempio:
- solco con modulazione laterale ampia: basse frequenze (bassa e ampia velocità della vibrazione dello stilo, vedi "costanti di tempo" qui sotto)
- solco seghettato: alte/altissime frequenze (alta velocità di vibrazione dello stilo, vedi "costanti di tempo" qui sotto)
- solco "puntinato": variazioni repentine di profondità, probabilmente per forte differenza stereo sulle medio/basse frequenze (azione asincrona delle bobine)
Chiaramente, in un segnale composito i tre esempi di cui sopra possono anche comparire insieme, nella stessa sezione di un qualunque solco.
Time Constants
"Costante di tempo" è un termine utilizzato, anche scientificamente, in diversi settori, e non ha un significato univoco. Nel nostro caso, indica il tempo di risposta tipico di un circuito elettrico, attraversato dal segnale di linea, in relazione ad una determinata frequenza del segnale stesso.
Quando parliamo di tempo di risposta noi presupponiamo, appunto, una risposta, cioè la produzione di un effetto che scaturisce dal circuito e dalle sue componenti. Abbiamo visto in precedenza che l'amplificatore di incisione fornisce corrente alle bobine della testina. Questa corrente ha l'effetto primario di generare induttanza, e l'effetto secondario di far vibrare lo stilo di incisione. Le caratteristiche di queste vibrazioni non dipendono solo dalla quantità di corrente, ma anche dalla frequenza e dalla costante di tempo ad essa associata.
Se si incide un segnale composto da una forma d'onda con frequenza di 1kHz, lo stilo vibra 1000 volte al secondo. In base alla relazione tra frequenza e periodo (T=1/f), quest’ultimo è di 1ms, pertanto la sequenza ciclica di queste 1000 vibrazioni si ripeterà ogni 1ms.
Il volume del nostro segnale determinerà quanto ampia sarà la vibrazione, ma non influirà su frequenza e periodo. Quindi lo stilo vibrerà sempre e comunque 1000 volte al secondo.
Allo stesso modo, se la forma d’onda ha una frequenza — ad esempio — di 6kHz, le vibrazioni al secondo saranno 6000, ed il periodo sarà più breve (0.17ms).
Thus, we can say that the “groove speed”— that is, the time in which the stylus reaches its maximum excursion and returns to its starting point — is directly proportional to the dominant signal frequency.
Moreover, regardless of the signal volume, low frequencies produce wider vibrations than mid and high frequencies, and mid frequencies produce wider vibrations than high frequencies.
For example, if a 1 kHz and a 200 Hz sine wave are recorded at the same volume, the 200 Hz wave will generate only 1/5 of the vibrations per second (200) compared to the 1 kHz wave. But since the volume is the same, each of the 200 vibrations will have excursions five times larger than the 1000, requiring slightly more time to complete.
So, at the same volume, the lower the frequency, the greater the energy in terms of stylus vibration amplitude, both horizontally and vertically.
Each frequency thus has an associated time constant, represented by the Greek letter “tau”:

and as stated before, high frequencies have smaller (faster) time constants and low frequencies vice versa.
By converting seconds to microseconds, the following conditional equation is obtained:

This equation, applied to 1 kHz, yields 59.23 µs, and for 200 Hz, 796.18 µs.
Repeating the same calculation for the extremes of the frequency range reproducible by a head (typically 20 Hz to 20 kHz), results are 7957.75 µs at 20 Hz and 7.95 µs at 20 kHz.
A questo punto si può cominciare ad intuire il perché della necessità dell'equalizzazione RIAA, a cui abbiamo accennato in precedenza.
Infatti, possiamo osservare che la costante di tempo dei 20Hz risulta 1000 volte più alta di quella dei 20kHz. E possiamo intuire che, in un contesto simile, sarebbe altamente inefficiente — in assenza di un‘equalizzazione correttiva — incidere su disco un segnale di linea contenente l’intero spettro di frequenze, poiché le basse frequenze causerebbero escursioni orizzontali e verticali troppo grandi dello stilo, e l‘opposto accadrebbe con le alte frequenze, rendendo il rapporto segnale/rumore inaccettabile.
La soluzione è quindi quella di attenuare le basse frequenze ed enfatizzare le alte frequenze in registrazione, per sopperire a questa sproporzione. Un'equalizzazione speculare dovrà essere poi applicata al segnale del circuito “phono” di riproduzione, per ripristinare la corretta risposta in frequenza.
The RIAA Curve
Negli anni ’60, la Recording Industry Association of America (RIAA) ha standardizzato alcune delle curve di equalizzazione proposte nel corso degli anni precedenti nella “curva RIAA" (vedi figura seguente), che rimane ad oggi la curva standard nel circuito di amplificazione “Phono”.
the dB(f) function includes, besides the frequency f, three time constants:

where
- t₁ is the high-frequency time constant (≈75 µs);
- t₂ is the mid-frequency time constant (≈318 µs);
- t₃ is the low-frequency time constant (≈3180 µs).

La curva è centrata sui 1000Hz. Quella della figura qui sopra è la curva RIAA di riproduzione. Un sistema di incisione, ovviamente, registra il suono con un'equalizzazione diametralmente opposta, cioè con le basse frequenze attenuate e le alte frequenze enfatizzate. Ovvero, semplificando:
in registrazione:
- -19.6dB a 20Hz
- 0dB a 1000Hz
- +19.6dB a 20Khz
in riproduzione:
- +19.6dB a 20Hz
- 0dB a 1000Hz
- -19.6dB a 20kHz
I circuiti di equalizzazione RIAA sono costituiti da una combinazione di filtri passa alto/passa basso. Oggi vengono quasi sempre implementati tramite reti di resistenze, condensatori e amplificatori operazionali.
Escursione verticale
Tra le due componenti in cui possiamo scomporre le vibrazioni dello stilo (escursione orizzontale e verticale), quella da tenere d'occhio è certamente l'escursione verticale.
Nell'ipotesi in cui:
- la differenza tra (±VL) e (±VR) è grande;
- il segnale ha un volume alto;
- la costante di tempo della frequenza prevalente è alta,
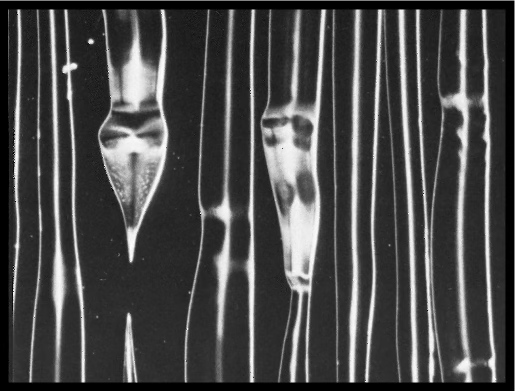
allora il solco può diventare prima molto profondo, e subito dopo molto sottile.
Difficilmente il solco può diventare così profondo da far sì che lo stilo tocchi l'anima di alluminio del disco master, danneggiandosi irrimediabilmente. Però un solco molto largo prima, e molto sottile dopo, può generare qualche rumorino in riproduzione. Inoltre, se diventa troppo sottile, il rischia di non essere più tracciabile. Il raggio medio di uno stilo di riproduzione è di 15µ, pertanto la larghezza del solco non dovrebbe mai scendere sotto i 30µ.
Va detto che la profondità del solco durante l'incisione è il prodotto di due fattori ben distinti:
- la profondità di base, impostata all'inizio dell'incisione, che dipende sia da regolazioni di tipo meccanico (sulla sospensione a cui è agganciata la testina), sia dall'azione elettromagnetica del moving coil della testina, la cui corrente viene regolata con un potenziometro, e che è lo strumento "di precisione" con cui si regola la profondità di base del solco, senza alcun segnale presente;
- l'escursione verticale, che si somma o si sottrae alla profondità di base quando il solco è modulato, come risultante della differenza tra (±VL) e (±VR).
Senza alcun intervento sul segnale, nei casi peggiori la situazione potrebbe essere quella della figura sottostante⁴.
Per evitare o contenere questi problemi, il contenuto del segnale viene corretto prima che questi arrivi all’amplificazione. Tra gli interventi più usati vi sono:
- filtro ellittico/mono-maker: è un filtro a banda passante con curva molto ripida, caratterizzato da un calcolo dei poli e degli zeri estremamente complesso, volto a minimizzare l'errore sia al di sopra che al di sotto della frequenza di crossover. Il segnale viene processato in modo che la banda passante abbia un'immagine stereo nulla, e quindi non produca alcuna escursione verticale dello stilo durante l'incisione. In questo modo si vanno eliminare le forti escursioni verticali dovute alla compresenza di alte differenze tra (±VL) e (±VR) e alte costanti di tempo alte, ma al tempo stesso si interviene sulla stereofonia in maniera contenuta, cioè solo fino ad una determinata frequenza. Questo filtro viene utilizzato da oltre 50 anni ed è spesso integrato come componente sempre attivo nei sistemi di incisione professionale. E' sicuramente il sistema più efficace, ma è anche abbastanza invasivo.
- MS equalization: allows separate equalization of the mono component (center of the stereo image) and the stereo component (sides). This is particularly useful when identifying the frequency at which depth variation occurs. Only the stereo component around the frequency of interest is equalized — just enough to reduce the variation. This method can yield highly effective results that are very difficult to detect audibly when compared to the original recording.
1, 4 Larry Boden, Basic Disc Mastering, USA 1981
2, 3Struck, Polygram Pitch Control IV user manual, internal files, UK-Europe 1977-82